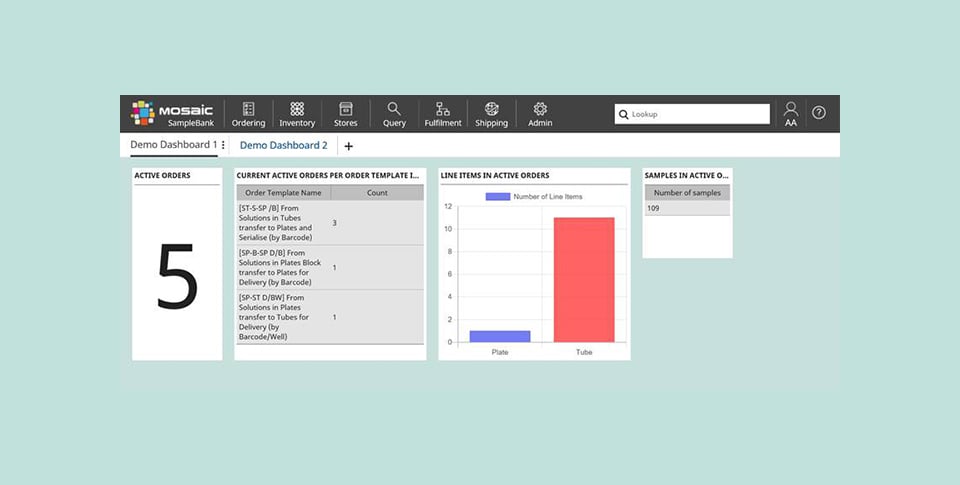
See up-to-date information such as metrics on samples received or despatched at a glance - Each user can select the information they want to see in their dashboards, displayed as bar charts, pie charts, tables and more.
Lab staff can quickly identify the next urgent order to work on or know how many newly received samples are awaiting processing.
Lab managers can easily supply efficiency reports to their management team, spot peaks of demand, or identify the emptiest freezer instantly.

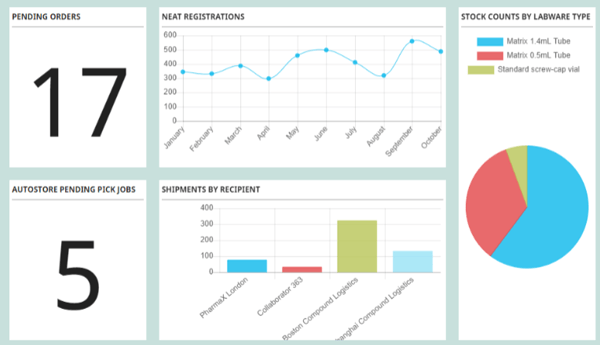

 Dashboards